Debugging the execution flow
Liberator encourages a declarative programming style: the developer is hidden from the algorithm and only provides callbacks at certain decision points. This enables a compact and powerful style of programming but, in case of an unexpected result, can make debugging a pain: there is no step through.
So show me the traces!
Although the developer cannot step through the sequence of decisions,
liberator can be told to trace the execution and report to the
developer. The namespace liberator.dev contains helper
functions for this.
Let’s take this example resource and trace it:
(def dbg-counter (atom 0))
(defresource dbg-resource
  :available-media-types ["text/plain"]
  :allowed-methods [:get :post]
  :handle-ok (fn [_] (format "The counter is %d" @dbg-counter))
  :post! (fn [_] (swap! dbg-counter inc)))
To enable request tracing wrap the request handler in
liberator.dev/wrap-trace. You can wrap either a single
resource or any ring middleware stack. The later is recommended to
make the trace ui easily accessible:
(defroutes dbg
  (ANY "/dbg-count" [] dbg-resource))

(def handler
  (-> dbg
      (wrap-trace :header :ui)))
The response will include a complete trace of the sequence of decisions together with the individual outcome:
$ curl -i http://localhost:3000/dbg-count
HTTP/1.1 200 OK
Date: Mon, 06 May 2013 08:23:11 GMT
X-Liberator-Trace: :decision (:service-available? true)
X-Liberator-Trace: :decision (:known-method? :get)
X-Liberator-Trace: :decision (:uri-too-long? false)
X-Liberator-Trace: :decision (:method-allowed? :get)
X-Liberator-Trace: :decision (:malformed? false)
X-Liberator-Trace: :decision (:authorized? true)
X-Liberator-Trace: :decision (:allowed? true)
X-Liberator-Trace: :decision (:valid-content-header? true)
X-Liberator-Trace: :decision (:known-content-type? true)
X-Liberator-Trace: :decision (:valid-entity-length? true)
X-Liberator-Trace: :decision (:is-options? false)
X-Liberator-Trace: :decision (:accept-exists? true)
X-Liberator-Trace: :decision (:media-type-available? {:representation {:media-type "text/plain"}})
X-Liberator-Trace: :decision (:accept-language-exists? nil)
X-Liberator-Trace: :decision (:accept-charset-exists? nil)
X-Liberator-Trace: :decision (:accept-encoding-exists? nil)
X-Liberator-Trace: :decision (:exists? true)
X-Liberator-Trace: :decision (:if-match-exists? nil)
X-Liberator-Trace: :decision (:if-unmodified-since-exists? nil)
X-Liberator-Trace: :decision (:if-none-match-exists? nil)
X-Liberator-Trace: :decision (:if-modified-since-exists? nil)
X-Liberator-Trace: :decision (:method-delete? false)
X-Liberator-Trace: :decision (:post-to-existing? false)
X-Liberator-Trace: :decision (:put-to-existing? false)
X-Liberator-Trace: :decision (:multiple-representations? false)
X-Liberator-Trace: :handler (:handle-ok)
Link: <//x-liberator/requests/xor3n>; rel=x-liberator-trace
X-Liberator-Trace-Id: xor3n
Vary: Accept
Content-Type: text/plain;charset=UTF-8
Content-Length: 16
Server: Jetty(7.6.1.v20120215)

The counter is 0
You can see that the media-type was negotiated and the decision function returned a map with the representation definition. This map was combined with the context at that time and makes the media-type available for the handler.
Also visible is that the part for conditional request was skipped. Try playing around with resources that use ETags (see Conditional Requests) and different methods and look how the request was processed. This will give you a good understanding of how to implement a more sophisticated resource.
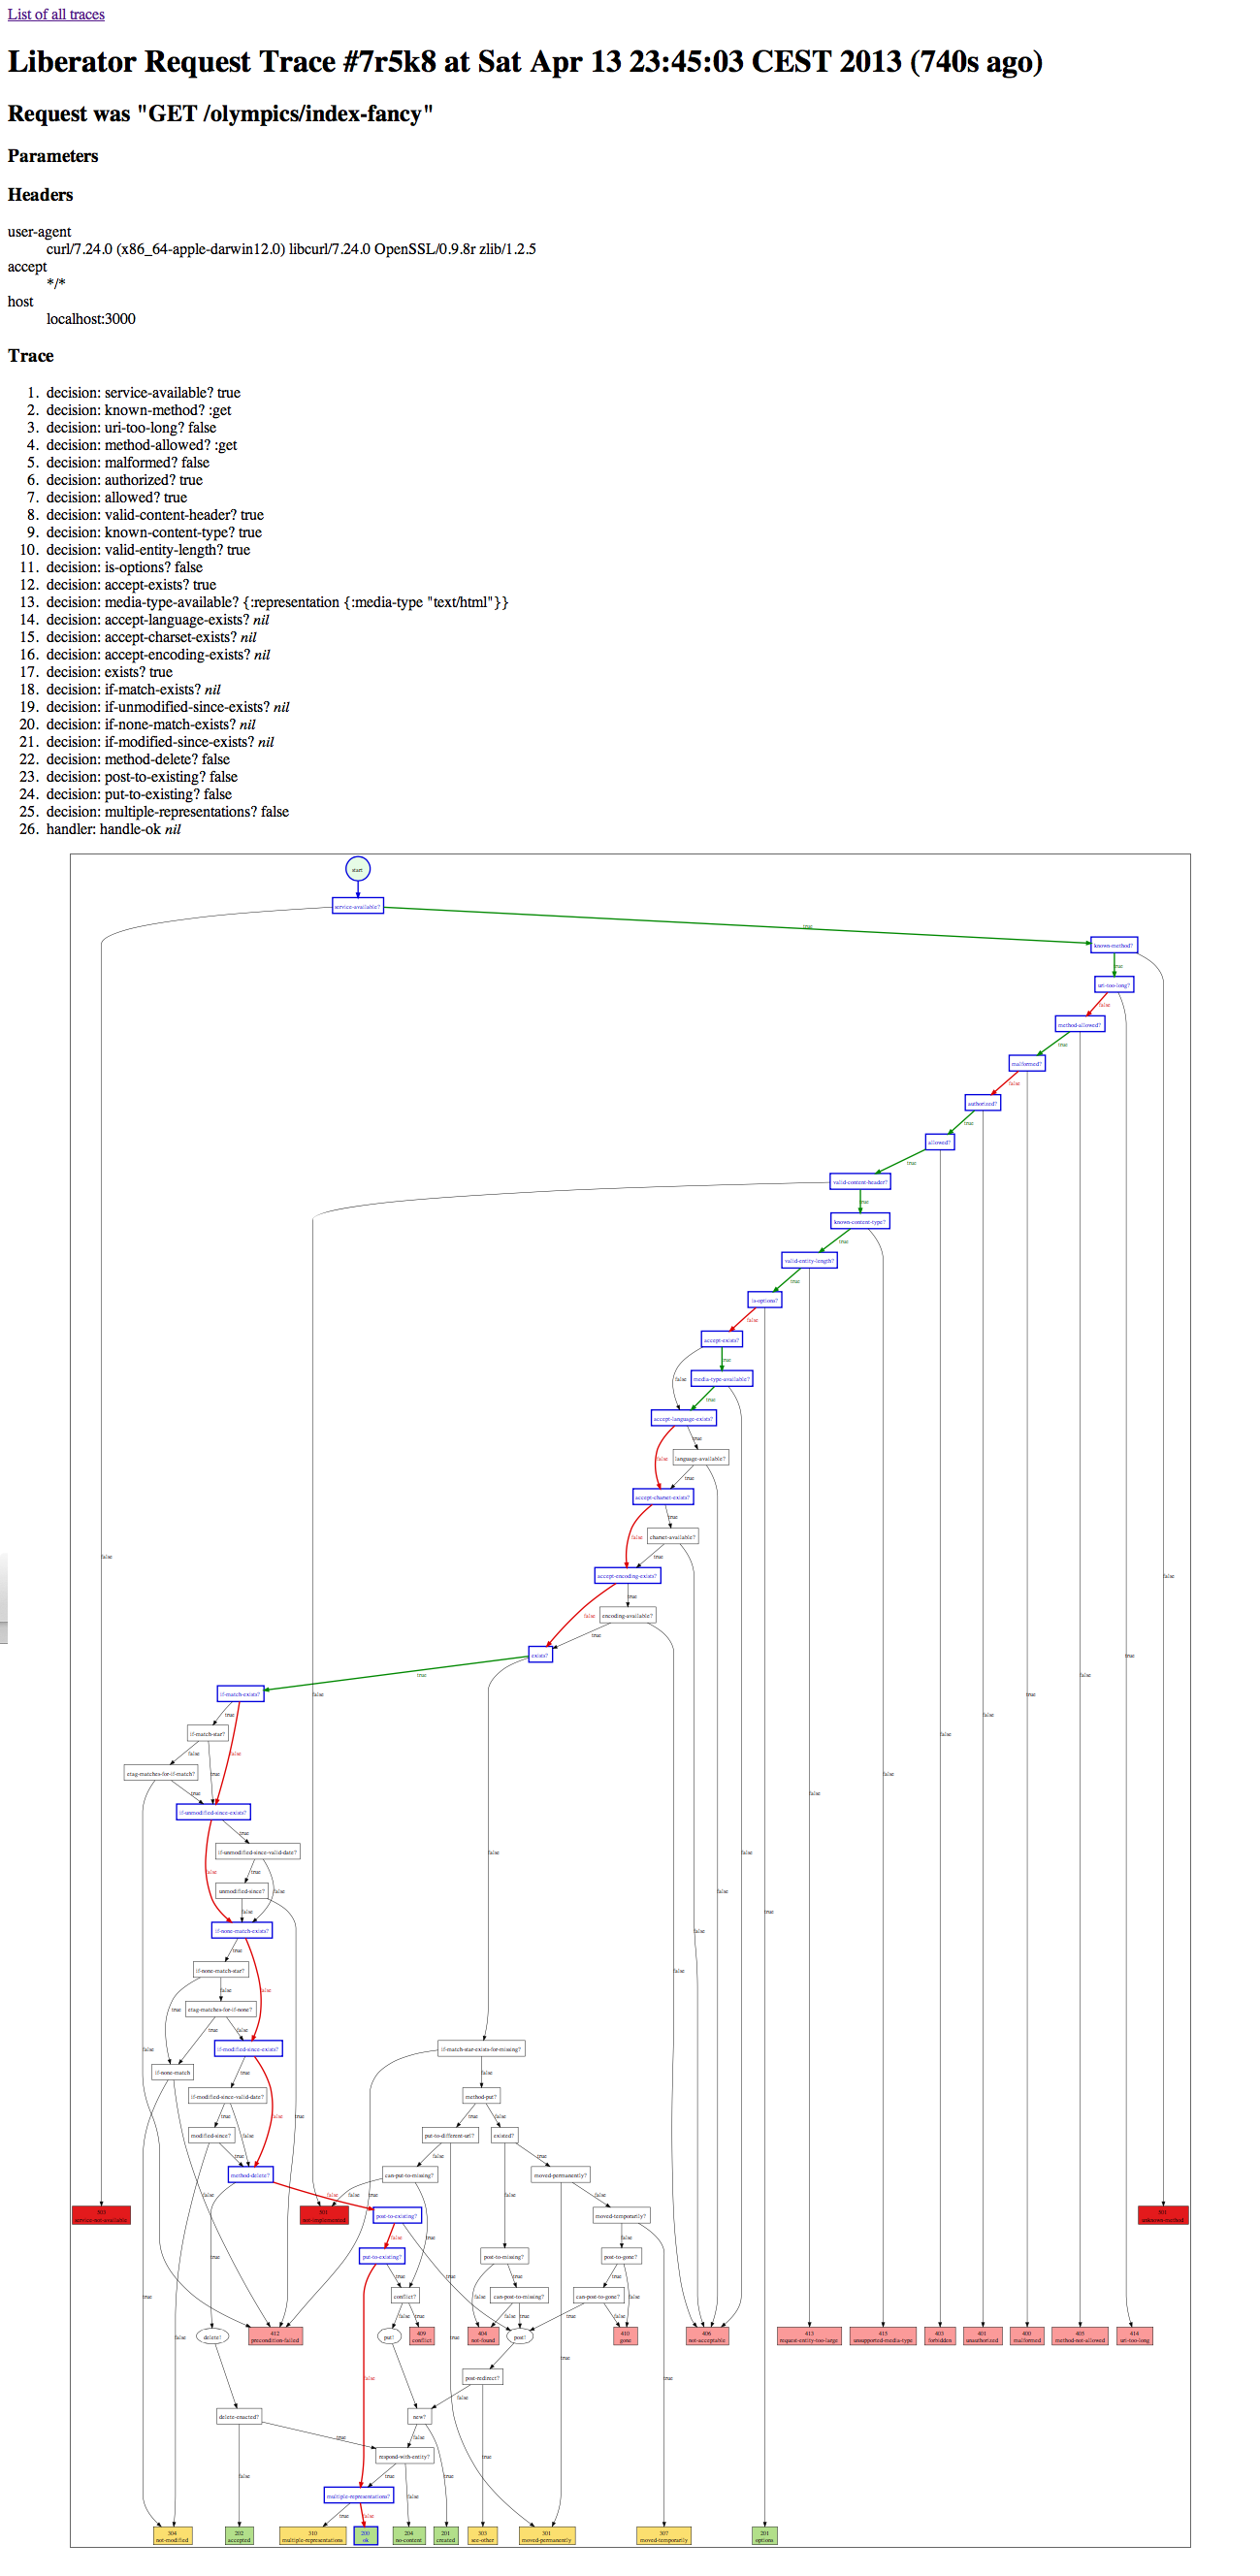
Trace UI
When you payed attention you’ve noticed that we provided two additional
keyword arguments to wrap-trace: :header and :ui. The
first let’s liberator include the trace as response headers which is
nice in the console. Sometimes this is not enough or response
headers are not easily available. Liberator provides a web resource at
http://localhost:3000/x-liberator/requests/ (the trailing slash
is required) where a list of recent requests can be found. The trace
for a single request can be selected there.

The trace ui shows for a single request the request including parameters and headers, the trace of decisions and the decision graph. It highlights the path that was taken for the request. The edges are colored depending on the boolean value of the decision.
Continue with content negotiation.
